Analyst Sets $320,000 Target As Wave 5 Begins
The Bitcoin price has finally broken out of resistance and is on a journey to the $320,000 threshold, according to a crypto analyst. Notably, the Bitcoin price has now returned into a full bullish sentiment, with the crypto fear and greed index now pointing to extreme greed.
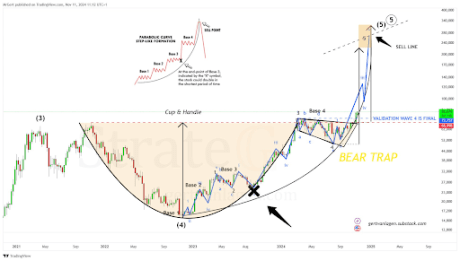
In a recent technical analysis, crypto analyst Gert van Lagen identified a bullish pattern in Bitcoin’s price chart, specifically pointing to a confirmed breakout of the classic ‘cup-and-handle’ pattern formation that has essentially kicked off a bullish Wave 5 run.
Bitcoin Price Sets Sights On $320,000 As Wave 5 Begins
Bitcoin’s price action has been nothing short of impressive in the past few days. Notably, the Bitcoin price has created multiple all-time highs in quick succession, as many investors start to pour in. This sustained demand has created successive bullish candles on both the daily and weekly charts, illustrating a continued strong upward momentum.
Related Reading
Interestingly, these bullish candle formations have validated what crypto analyst Gert van Lagen called the start of a sub-wave 5 formation. This wave, which is known to be bullish, is expected to be the final sub-wave formation in a larger Elliot wave uptrend that has been in play since January 2023.
Supporting the possibility of the wave 5 formation, technical analysis of the Bitcoin price formation shows that the recent price rally has seen Bitcoin breaking out of a cup-and-handle formation. This pattern, which is known to be bullish, has been in formation since 2022. The ‘cup’ portion of this pattern began forming in early 2022 and eventually ended with Bitcoin’s peak above $73,700 in March 2024. The subsequent consolidation phase, which lasted until October, represents the ‘handle’ segment of the pattern.
In addition to this, Bitcoin has managed to break free from what van Lagen described as a ‘base 4 step-wise formation,’ effectively shaking off a bear trap. With this breakout now confirmed, van Lagen’s analysis points to a projected target range between $220,000 and $320,000. This range marks what he considers a ‘major sell line,’ which is a zone where profit-taking might intensify as Bitcoin reaches these upper limits.

Related Reading
Current State Of BTC
At the time of writing, Bitcoin is trading at $89,500 with a market cap of $1.77 trillion and an all-time high of $89,864, having increased by about 10.5% in the past 24 hours. However, given this trend, this all-time high might not last long. The bullish sentiment and inflow surrounding Bitcoin has been so massive that investors don’t know when to take profit at the moment. The RSI is above 70 on every single timeframe from the daily to the yearly. This shows how strong the buying momentum is at the moment.
Nevertheless, the momentum is expected to continue, with the next target at $90,000 and another at $100,000. A move to Gert van Lagen’s target of $220,000 to $320,000 will represent a 145% and 255% increase, respectively, from the current price.
Featured image created with Dall.E, chart from Tradingview.com


